
Page 27 - ภาษาอังกฤษสำหรับสายวิทยาการอุตุนิยมวิทยา
P. 27
22
3. Aneroid Barometer
An aneroid barometer uses a closed hollow container, partially emptied of air, to measure
atmospheric pressure. The container is sensitive to differences in atmospheric pressure;
when pressure increases the container is slightly compressed, when pressure decreases the
container expands slightly. The hollow container is connected to an arm that indicates the
pressure on a graduated scale. The aneroid barometer is smaller and easier to move around
than a mercurial barometer, but generally it is less accurate and more likely to need
adjustment. When it is used for official measurements it must be checked by comparing it
with a mercurial barometer at least once a week.
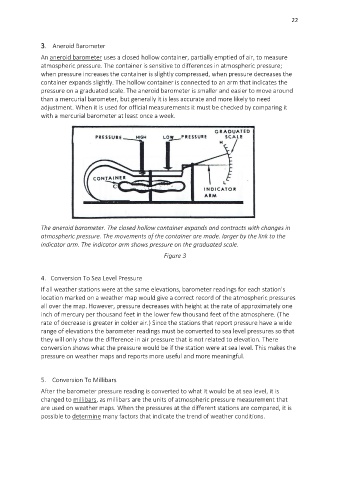
The aneroid barometer. The closed hollow container expands and contracts with changes in
atmospheric pressure. The movements of the container are made. larger by the link to the
indicator arm. The indicator arm shows pressure on the graduated scale.
Figure 3
4. Conversion To Sea Level Pressure
If all weather stations were at the same elevations, barometer readings for each station's
location marked on a weather map would give a correct record of the atmospheric pressures
all over the map. However, pressure decreases with height at the rate of approximately one
inch of mercury per thousand feet in the lower few thousand feet of the atmosphere. (The
rate of decrease is greater in colder air.) Since the stations that report pressure have a wide
range of elevations the barometer readings must be converted to sea level pressures so that
they will only show the difference in air pressure that is not related to elevation. There
conversion shows what the pressure would be if the station were at sea level. This makes the
pressure on weather maps and reports more useful and more meaningful.
5. Conversion To Millibars
After the barometer pressure reading is converted to what it would be at sea level, it is
changed to millibars, as millibars are the units of atmospheric pressure measurement that
are used on weather maps. When the pressures at the different stations are compared, it is
possible to determine many factors that indicate the trend of weather conditions.