
Page 70 - AFMAN 15-111, 12 MAR 2019
P. 70
70 AFMAN15-111 12 MARCH 2019
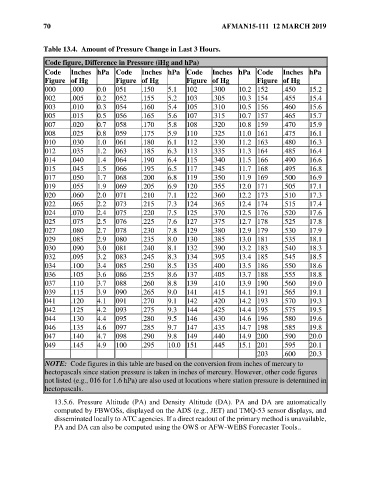
Table 13.4. Amount of Pressure Change in Last 3 Hours.
Code figure, Difference in Pressure (iHg and hPa)
Code Inches hPa Code Inches hPa Code Inches hPa Code Inches hPa
Figure of Hg Figure of Hg Figure of Hg Figure of Hg
000 .000 0.0 051 .150 5.1 102 .300 10.2 152 .450 15.2
002 .005 0.2 052 .155 5.2 103 .305 10.3 154 .455 15.4
003 .010 0.3 054 .160 5.4 105 .310 10.5 156 .460 15.6
005 .015 0.5 056 .165 5.6 107 .315 10.7 157 .465 15.7
007 .020 0.7 058 .170 5.8 108 .320 10.8 159 .470 15.9
008 .025 0.8 059 .175 5.9 110 .325 11.0 161 .475 16.1
010 .030 1.0 061 .180 6.1 112 .330 11.2 163 .480 16.3
012 .035 1.2 063 .185 6.3 113 .335 11.3 164 .485 16.4
014 .040 1.4 064 .190 6.4 115 .340 11.5 166 .490 16.6
015 .045 1.5 066 .195 6.5 117 .345 11.7 168 .495 16.8
017 .050 1.7 068 .200 6.8 119 .350 11.9 169 .500 16.9
019 .055 1.9 069 .205 6.9 120 .355 12.0 171 .505 17.1
020 .060 2.0 071 .210 7.1 122 .360 12.2 173 .510 17.3
022 .065 2.2 073 .215 7.3 124 .365 12.4 174 .515 17.4
024 .070 2.4 075 .220 7.5 125 .370 12.5 176 .520 17.6
025 .075 2.5 076 .225 7.6 127 .375 12.7 178 .525 17.8
027 .080 2.7 078 .230 7.8 129 .380 12.9 179 .530 17.9
029 .085 2.9 080 .235 8.0 130 .385 13.0 181 .535 18.1
030 .090 3.0 081 .240 8.1 132 .390 13.2 183 .540 18.3
032 .095 3.2 083 .245 8.3 134 .395 13.4 185 .545 18.5
034 .100 3.4 085 .250 8.5 135 .400 13.5 186 .550 18.6
036 .105 3.6 086 .255 8.6 137 .405 13.7 188 .555 18.8
037 .110 3.7 088 .260 8.8 139 .410 13.9 190 .560 19.0
039 .115 3.9 090 .265 9.0 141 .415 14.1 191 .565 19.1
041 .120 4.1 091 .270 9.1 142 .420 14.2 193 .570 19.3
042 .125 4.2 093 .275 9.3 144 .425 14.4 195 .575 19.5
044 .130 4.4 095 .280 9.5 146 .430 14.6 196 .580 19.6
046 .135 4.6 097 .285 9.7 147 .435 14.7 198 .585 19.8
047 .140 4.7 098 .290 9.8 149 .440 14.9 200 .590 20.0
049 .145 4.9 100 .295 10.0 151 .445 15.1 201 .595 20.1
203 .600 20.3
NOTE: Code figures in this table are based on the conversion from inches of mercury to
hectopascals since station pressure is taken in inches of mercury. However, other code figures
not listed (e.g., 016 for 1.6 hPa) are also used at locations where station pressure is determined in
hectopascals.
13.5.6. Pressure Altitude (PA) and Density Altitude (DA). PA and DA are automatically
computed by FBWOSs, displayed on the ADS (e.g., JET) and TMQ-53 sensor displays, and
disseminated locally to ATC agencies. If a direct readout of the primary method is unavailable,
PA and DA can also be computed using the OWS or AFW-WEBS Forecaster Tools..