
Page 68 - AFMAN 15-111, 12 MAR 2019
P. 68
68 AFMAN15-111 12 MARCH 2019
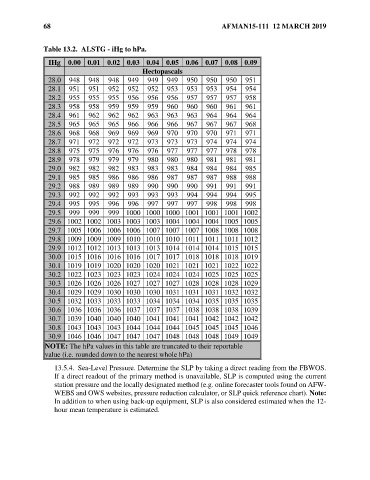
Table 13.2. ALSTG - iHg to hPa.
IHg 0.00 0.01 0.02 0.03 0.04 0.05 0.06 0.07 0.08 0.09
Hectopascals
28.0 948 948 948 949 949 949 950 950 950 951
28.1 951 951 952 952 952 953 953 953 954 954
28.2 955 955 955 956 956 956 957 957 957 958
28.3 958 958 959 959 959 960 960 960 961 961
28.4 961 962 962 962 963 963 963 964 964 964
28.5 965 965 965 966 966 966 967 967 967 968
28.6 968 968 969 969 969 970 970 970 971 971
28.7 971 972 972 972 973 973 973 974 974 974
28.8 975 975 976 976 976 977 977 977 978 978
28.9 978 979 979 979 980 980 980 981 981 981
29.0 982 982 982 983 983 983 984 984 984 985
29.1 985 985 986 986 986 987 987 987 988 988
29.2 988 989 989 989 990 990 990 991 991 991
29.3 992 992 992 993 993 993 994 994 994 995
29.4 995 995 996 996 997 997 997 998 998 998
29.5 999 999 999 1000 1000 1000 1001 1001 1001 1002
29.6 1002 1002 1003 1003 1003 1004 1004 1004 1005 1005
29.7 1005 1006 1006 1006 1007 1007 1007 1008 1008 1008
29.8 1009 1009 1009 1010 1010 1010 1011 1011 1011 1012
29.9 1012 1012 1013 1013 1013 1014 1014 1014 1015 1015
30.0 1015 1016 1016 1016 1017 1017 1018 1018 1018 1019
30.1 1019 1019 1020 1020 1020 1021 1021 1021 1022 1022
30.2 1022 1023 1023 1023 1024 1024 1024 1025 1025 1025
30.3 1026 1026 1026 1027 1027 1027 1028 1028 1028 1029
30.4 1029 1029 1030 1030 1030 1031 1031 1031 1032 1032
30.5 1032 1033 1033 1033 1034 1034 1034 1035 1035 1035
30.6 1036 1036 1036 1037 1037 1037 1038 1038 1038 1039
30.7 1039 1040 1040 1040 1041 1041 1041 1042 1042 1042
30.8 1043 1043 1043 1044 1044 1044 1045 1045 1045 1046
30.9 1046 1046 1047 1047 1047 1048 1048 1048 1049 1049
NOTE: The hPa values in this table are truncated to their reportable
value (i.e. rounded down to the nearest whole hPa)
13.5.4. Sea-Level Pressure. Determine the SLP by taking a direct reading from the FBWOS.
If a direct readout of the primary method is unavailable, SLP is computed using the current
station pressure and the locally designated method (e.g. online forecaster tools found on AFW-
WEBS and OWS websites, pressure reduction calculator, or SLP quick reference chart). Note:
In addition to when using back-up equipment, SLP is also considered estimated when the 12-
hour mean temperature is estimated.